Electrophoretic Mobility Shift Assay Guide
Introduction
Gel shift assays or electrophoretic mobility shift assays (EMSA) provide a simple method to study DNA-protein interactions. This assay is based on the principle that a DNA-protein complex will have different mobility during electrophoresis than non-bound DNA. These shifts can be visualized on a native acryla- mide gel using labeled DNA to form the DNA-protein binding complex. To date, protocols require label- ing DNA by (1) radioisotope, (2) digoxygenin, or (3) biotin. Odyssey Imagers (LI-COR Biosciences) offer a quick and easily-adapted alternative method to radioisotopic and chemiluminescent detection methods for EMSA analysis and visualization.
A DNA oligonucleotide end-labeled with LI‑COR IRDye is a good substrate for protein binding. LI‑COR offers pre-annealed oligonucleotides specific to eight unique binding proteins. DNA detection using IRDye reagents is linear within a 50-fold dilution range, from 9.1 fmol to 0.18 fmol. Additional benefits include no hazardous radioisotope, no gel transfer to membrane or gel drying, no chemiluminescent substrate reagents, and no film exposure. Following electrophoresis, the gel can be imaged while remaining in the glass plates. If necessary, the gel can be placed back in the electrophoresis unit and run longer.
Existing mobility shift assay protocols can be easily transformed into infrared assays by replacing the existing DNA oligonucleotides with oligonucleotides end-labeled with IRDye reagents. The binding conditions and electrophoresis conditions will remain the same as with any other EMSA detection method.
General Methodology
EMSA Oligonucleotides Labeled with IRDye 700
| Part Number | |
| IRDye 700 p53 Consensus Oligonucleotide | 829-07921 |
| IRDye 700 STAT3 Consensus Oligonucleotide | 829-07922 |
| IRDye 700 CREB Consensus Oligonucleotide | 829-07923 |
| IRDye 700 NFκB Consensus Oligonucleotide | 829-07924 |
| IRDye 700 AP-1 Consensus Oligonucleotide | 829-07925 |
| IRDye 700 Sp-1 Consensus Oligonucleotide | 829-07926 |
| IRDye 700 HIF-1 Consensus Oligonucleotide | 829-07929 |
| EMSA Buffer Kit for the Odyssey | 829-07910 |
Labeling DNA Fragments with IRDye Infrared Dyes
To obtain DNA fragments end-labeled with IRDye infrared dyes, oligos labeled with IRDye infrared dyes are used. It is critical that the DNA fragment is end-labeled rather than having dye incorporated into the DNA, which interferes with the formation of the DNA-protein complex.
Oligonucleotides are manufactured in single strand form; therefore, both forward and reverse DNA oligonucleotides must be purchased. Once oligonucleotides are obtained, they need to be annealed to form a double-stranded DNA fragment.
Oligonucleotides are annealed by placing the oligonucleotide set in a 100 °C heat block for 5 minutes and then leaving the oligonucleotides in the heat block and turning it off to slowly cool to room temperature.
Both oligonucleotide sequences should be end-labeled with the same IRDye infrared dye. There is a significant decline (~70%) in signal intensity when using only one end-labeled oligonucleotide.
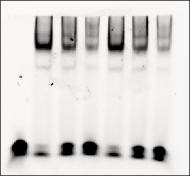
Mobility Shift Sample Protocol (NFκB)
Each oligo labeled with IRDye 700 provided by LICORbio for EMSA reactions will have an optimized protocol to measure the protein-DNA interaction. See the specific EMSA oligo pack insert for more information. As an example, the NFκB protein-DNA interaction will be described in this document.
Gel Preparation
Native pre-cast polyacrylamide gels such as 5% TBE (BioRad) or 4-12% TBE (Invitrogen) are recommended. Alternatively, the recipe below can be used to prepare a 4% native gel.
The protein shift detected on each gel type (i.e., 5% vs 4-12%) will be unique.
Prepare 4% native polyacrylamide gel containing 50 mM Tris, pH 7.5; 0.38 M glycine; and 2 mM EDTA:
For 40 mL mix:
- 5 mL 40% polyacrylamide stock (Polyacrylamide-BIS ratio = 29:1)
- 2 mL 1 MTris, pH 7.5
- 7.6 mL 1 M Glycine 160 μL 0.5 M EDTA 26 mL H2O
- 200 μL 10% APS
- 30 μL TEMED
Pour the gel between glass plates and wait about 1-2 hours to polymerize.
Oligo Preparation
EMSA oligonucleotides from LICORbio are pre-annealed.
-
Dilute oligos in 1X TE for final concentration of 20 pmol/μL.
-
Place 5 μL of forward IRDye 700 oligo into a new tube and add 5 μL of reverse IRDye 700 oligo.
-
Anneal oligos by placing the oligo set in a 100 °C heat block for 3 minutes. Leave the oligos in the heat block and turn it off to slowly cool to room temperature.
-
Dilute annealed oligos 1 μL in 199 μL water. This is your working DNA stock. Oligos can be stored at -20 °C for up to a year if protected from light.
Binding Reaction
For NFκB IRDye 700 oligonucleotide, the following binding reaction is a good starting point.
|
Reaction |
µL |
|
10X Binding Buffer (100 mM Tris, 500 mM KCl, 10 mM DTT; pH 7.5) |
2 |
|
Poly(dI•dC) 1 μg/μL in 10 mM Tris, 1 mM EDTA; pH 7.5 |
1 |
|
25 mM DTT/2.5% Tween® 20 |
2 |
|
Water |
13 |
|
IRDye 700 NFκB |
1 |
|
Raji nuclear extract (Positive control) (5 μg/μL) |
1 |
|
TOTAL |
20 |
After the addition of the DNA to the protein-buffer mix, reactions are incubated to allow protein binding to DNA. A typical incubation condition is 20-30 minutes at room temperature. Since IRDye 700 infrared dye is sensitive to light, it is best to keep binding reactions in the dark during incubation periods (e.g., put tubes into a drawer or cover the tube rack with aluminum foil).
Electrophoresis
-
Add 1 μL of 10X Orange loading dye (LI-COR, P/N 927-10100), mix, and load on a gel.
-
Run the gel at 10 V/cm for about 30 minutes in non-denaturing buffer (i.e., 1X TGE or TBE buffer).
For best results, electrophoresis should be performed in the dark (simply put a cardboard box over the electrophoresis apparatus).
Imaging
Gels can be imaged either inside the glass plates or removed from the glass plate. When removing gel from the glass plates, take care not to deform or tear the gel. Scan the gel. Please refer to your manual for specific information on your model of imager.
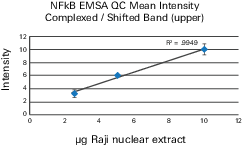
EMSA Quantification Guidelines
Accurate quantification of the unbound fluorescent DNA fragment can be difficult. Follow these guidelines to make quantification as accurate as possible:
-
Add 5 mM DTT and 0.5% Tween® 20 to all binding reactions to stabilize the dye and improve the accuracy of quantification. Without DTT/Tween® 20, unbound DNA fragments exhibit much less fluorescent signal than DNA fragments bound to protein, making it impossible to accurately quantify the unbound DNA.
- Non-specific binding can occur between end-labeled oligonucleotides and the nuclear extract. Therefore, do not assume that signal from the DNA-only band in the control will equal the sum of the signal from the free and bound DNA in samples where the protein-DNA reaction occurs.
- Free oligonucleotides form a smear rather than a tight band, making it more difficult to quantify signal intensity.
Optimization
Binding Reaction
A universal binding condition that applies to every protein-DNA interaction cannot be recommended, since binding conditions are specific for each protein-DNA interaction. Thus, the user should establish binding reaction conditions for each protein-DNA pair. Binding buffer should be the same for this method as with any other mobility shift detection method used.
After the addition of DNA to the protein-buffer mix, reactions are incubated to allow protein to bind to DNA. Time required for binding is the same as when radioactively-labeled DNA fragments are used; a typical incubation condition is 20-30 minutes at room temperature. Since IRDye reagents are sensitive to light, it is best to keep binding reactions in darkness during incubation periods (e.g., put tubes into a drawer or simply cover the tube rack with aluminum foil). After the incubation period, native loading dye is added to the binding reaction.
In some cases, it was observed that DNA control reactions (no protein) have lower signal than reactions containing protein. This may be due to lower stability of the dye in certain buffer conditions. The addition of 5 mM DTT and 0.5% Tween 20 to all reactions reduces this phenomenon.
It is critical not to use any blue loading dye (e.g., bromophenol blue), as this will be visible on the Odyssey image. Use 10X Orange loading dye instead (LI‑COR, P/N 927-10100).
|
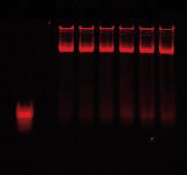
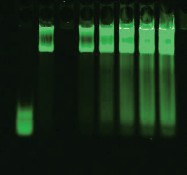
AP-1 consensus/mutant binding 700 nm/800 nm image |
AP-1 consensus/mutant binding 700 nm image |
AP-1 consensus/mutant binding 800 nm image |
|
|
|
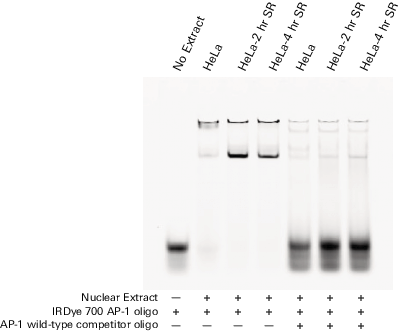
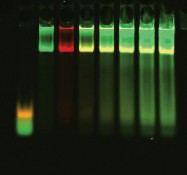
Competition using mutant DNA duplexes is another common method to determine binding specificity. A mutant DNA sequence is used to compete with the wild-type binding sequence. Specific binding is observed when mutant DNA (unlabeled) does not reduce the binding of labeled wild-type DNA. Two-color analysis of mutant vs. wild-type binding is done using the Odyssey Infrared Imaging System. The wild-type oligos are labeled with IRDye 700 phosphoramidite and mutant oligos with IRDye 800 phosphoramidite. In the figure above, the mutant non-specific binding is very intense (800 nm image); however, there is no decrease in wild-type binding (700 nm image).
| Lane 1 | Free IRDye 700 AP-1 consensus oligonucleotide and IRDye 800 AP-1 mutant oligonucleotide with no nuclear extract |
| Lane 2 | Nuclear extract with 0:1 ratio of IRDye 700 AP-1 consensus oligonucleotide to IRDye 800 AP-1 mutant oligonucleotide |
| Lane 3 | Nuclear extract with 1:0 ratio of IRDye 700 AP-1 consensus oligonucleotide to IRDye 800 AP-1 mutant oligonucleotide |
| Lane 4 | Nuclear extract with 1:1 ratio of IRDye 700 AP-1 consensus oligonucleotide to IRDye 800 AP-1 mutant oligonucleotide |
| Lane 5 | Nuclear extract with 1:2 ratio of IRDye 700 AP-1 consensus oligonucleotide to IRDye 800 AP-1 mutant oligonucleotide |
| Lane 6 | Nuclear extract with 1:3 ratio of IRDye 700 AP-1 consensus oligonucleotide to IRDye 800 AP-1 mutant oligonucleotide |
| Lane 7 | Nuclear extract with 1:4 ratio of IRDye 700 AP-1 consensus oligonucleotide to IRDye 800 AP-1 mutant oligonucleotide |
| Lane 8 | Nuclear extract with 1:5 ratio of IRDye 700 AP-1 consensus oligonucleotide to IRDye 800 AP-1 mutant oligonucleotide |
References
-
Wolf, S.S., Hopley, J.G., and Schweizer, M. (1994) The Application of 33P-Labeling in the Electrophoretic Mobility Shift Assay. Biotechniques 16, 590-592.
-
Suske, G., Gross, B., and Beato, M. (1989) Non-radioactive method to visualize specific DNA-protein interactions in the band shift assay. Nucleic Acids Research, 17, 4405.
-
Ludwig, L.B., Hughes, B.J., and Schwartz, S.A. (1995) Biotinylated probes in the electrophoretic mobility shift assay to examine specific dsDNA, ssDNA or RNA-protein interactions. Nucleic Acids Research, 23, 3792-3793.