Signal Analysis Workflow in Empiria Studio® Software
This page has step-by-step instructions for using the Signal Analysis workflow in Empiria Studio Software.
![]()
Workflow Overview: Use the Signal Analysis workflow to analyze assays such as dot blots, slot blots, and plate arrays.
In this workflow, you will draw shapes on the image around regions of interest that you want to quantify. The Signal Analysis workflow does not provide band or lane finding features that are provided in Western blot workflows. See Western Blot Analysis for more information.
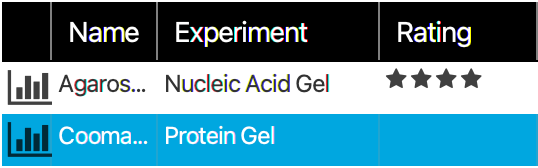
Name
To help with record-keeping, give every Experiment a distinct name. The description field provides space for you to include important details about the Experiment.
Quantify shapes
Use one of these options to draw shapes around regions of the image that you want to quantify.
-
Quantification is performed for fluorescence and chemiluminescence channels. Shapes are visible on RGB channels, but quantification is not performed for RGB channels.
-
You do not necessarily need to make all the shapes you place the same size, but you do need to ensure that shapes do not overlap. If you do want to make shapes the same size, it's generally easiest to place a shape around the largest region that you want to quantify and copy the shape to other regions you want to quantify.
See "Copy Shape(s) on the Image" and "Copy Shape(s) from Another Experiment" for more information.
Tools
Draw Shapes
-
Click to draw a circle around a region of interest.
-
Click to draw a square around a region of interest.
-
Quantification shapes are designated with the letter "S" and a number.
Copy Shape(s) on the Image
-
Select the shape or shapes that you want to copy.
To select multiple shapes, use CTRL + Click (⌘ + Click on macOS) to select the shapes or press SHIFT and drag the pointer over the shapes.
-
Press CTRL + C (⌘ + C) to copy the shapes.
-
Press CTRL + V (⌘ + V) to paste the shapes.
The location of the pasted shape is determined by your pointer and the number of shapes you are pasting.
-
If one shape is pasted, the shape will be pasted with the pointer in the center of the shape.
-
If multiple shapes are pasted, the shapes will be pasted below and to the right of the pointer.
Figure 264. Select multiple shapes by pressing SHIFT and dragging the pointer over shapes. Press CTRL + C (⌘ + C) to copy shapes, and press CTRL + V (⌘ + V) to paste the shapes. -
Copy Shape(s) from Another Experiment
Click Copy from Experiment to copy shapes from another Signal Analysis Experiment into the current Signal Analysis Experiment.
Shapes can only be copied from a Signal Analysis Experiment that has images with the same resolution as the image in the current Signal Analysis Experiment.
Background
To determine background using a shape, select the shape on the image and then click Assign Shape. Background shapes are labeled with the letter "B" and a number.
If a background shape is selected, the button will say Unassign. Click Unassign to change the shape from a background shape to a regular quantification shape.
See Signal Analysis Calculations for more information about background calculations and other calculations.
Options
Delete shape
-
Select the shape or shape(s).
Multiple shapes can be selected by pressing SHIFT and dragging the pointer over shapes.
-
Click Delete.
You can also press DELETE on the keyboard.
View data
Click Analysis Table  to view quantification data and other values. Signal will only be shown if a background shape has been assigned.
Review and report
The data in the report is organized into sections. Click to expand a section to view data and export options.
Images
-
Click above an image to export the image. Images can be exported as a high-resolution TIFF for publication in a journal or as a PNG appropriate for slide presentations. Do not use these images for analysis.
-
The units for image size can be set to English or metric on the General Options page.
-
Click to hide shapes. If shapes are hidden, they will not be included in the exported image or report.
Tables
Click Export above a table to export the data in the table in CSV or Excel (XLSX) format.
Export Menu Options
On the right side of the window, there is a menu with three export options.
-
Click PDF Report to export a PDF of the images and data on the Review and report page.
-
Click Experiment File to export all the images, quantification steps, and data from this Experiment to a single file that can be imported into Empiria Studio on another computer.
-
Click All Report Images to export all images from the Experiment to separate files for use in print publications or digital media (such as a slide presentation). Do not use these images for analysis.
In the export dialog, click Browse to find a parent folder for the images and enter a name for a new folder in the Folder Name field. The images will be exported into the new folder, which will be inside the parent folder.
Rate Experiment
Rate the Experiment for your records. This is an opportunity to record if the Experiment went "well" or not, depending on the specific requirements for your research.
Done
Click Done to mark this Experiment as complete and return to the Experiment List.