DNA Analysis Overview
When an image with a DNA Gel Analysis is the current image, the DNA Gel Analysis tab is shown on the ribbon. To apply a DNA Gel Analysis to an image, click the quick launch button at the top of the window and select DNA Gel from the drop-down menu. Or, open the Analysis tab and select DNA Gel from the drop-down menu in the Type group. The last used parameters are used to create the new analysis.
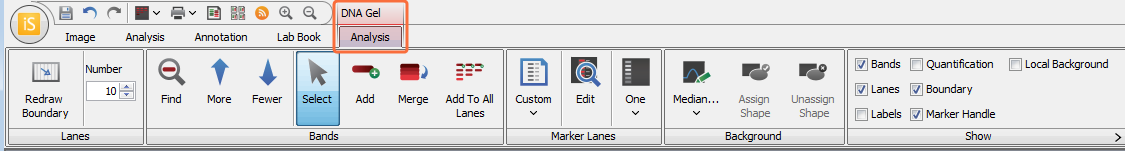
Lanes Group
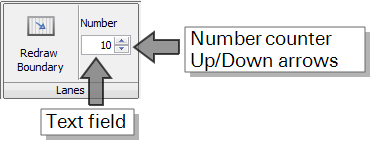
When a DNA Gel Analysis is added to an image, equally spaced lanes are created in a Lane Location Rectangle using the number of lanes specified in the number of lanes field in the Lanes group. The lane widths are based on the band widths found in the image.
To change the lanes, use the controls in the Lanes group to redraw the boundary and/or to change the number of lanes.
If there are already lanes defined on the current analysis, redrawing the boundary deletes those lanes. Nothing is preserved from the deleted lanes such as edited bands.
To redraw the boundary:
- Click the Redraw Boundary button.
- Click the upper left corner of the area to define and drag the boundary box to the bottom right of the area to define, then release the mouse button.
- Use the Number counter to increase or decrease the number of lanes. You can use the Up and Down arrows to increase or decrease the number, or type the number of lanes in the text field.
-
- After the lanes are defined, you can manually fine tune them by moving the lanes. Click the lane to select it, then drag the top or the bottom to tilt it or hold down the shift key to move the whole lane left or right to a new position. To select more than one lane to move or tilt, hold down the CTRL key while clicking (selecting) the lanes. Move the cursor to the top or bottom of the lane and when the cursor turns to the four-pointed arrow, drag it left or right to tilt the group; or hold down the SHIFT key, drag the cursor left or right to move the group. (See illustration in the Lanes group section of Western Analysis.)
During the Find Bands process, the lanes are also adjusted to optimize their intersection with the bands.
After band finding is complete, if you move or resize a lane, the band-finding process is repeated using the same parameters.
Bands Group
Use the controls in the Bands group to find bands, to adjust the band finding parameters to find More or Fewer bands, to Add Bands, to Merge bands, and to Add Bands to All Lanes.
- Click Find Bands.
- Review the results. If there are too many bands, click the Fewer arrow; if there are too few bands, click the More arrow. Repeat if necessary. The button is grayed out when the More and Fewer controls have reached their respective upper or lower end of the band sensitivity range.
-
To insert a band into a lane, click the Add button at the point on a lane you want the band added. The width of the band is the width of the current lane.
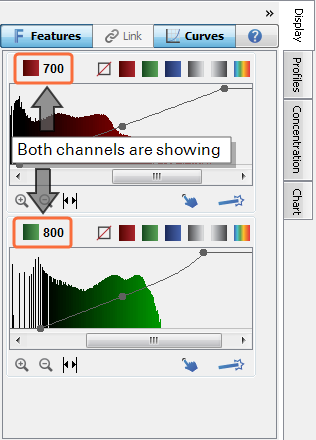
To manually Add or Edit a band, the display must be set to a single channel...Use the Display Channel Color buttons in the Display tab to turn on/off channels.
- If a band is shown as several bands instead of a single band, select the bands and click the Merge button.
- Click Add to All Lanes and drag the horizontal line on the image to where you want to add Bands. Click the line and Bands are added along the horizontal line in all defined Lanes.
Marker Group
Use the controls in the Marker Lanes group to select the Marker set to use, to specify the number of markers, and to add new markers or delete selected markers.
When you initially define sizing for an analysis, the number of marker lanes are assigned from the left-most lane, continuing to lanes to the right.
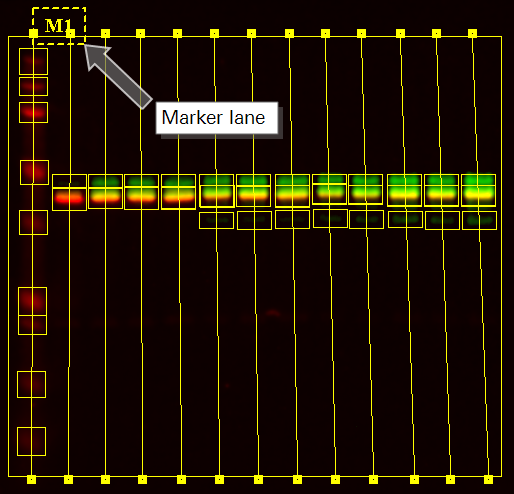
The sizes defined in the marker lane set are assigned from the bands in the marker lanes from top to bottom.
Sizing information is displayed in the Bands Table using the Size column. For bands in the Marker Lanes, the sizes are the standard's sizes; for all other bands, the sizes are calculated. See Bands Table for more information.
Selecting a Marker
- Click the template button to display the drop-down list of available Marker templates.
-
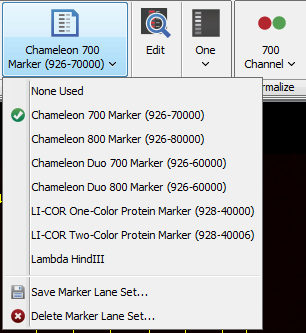
- Select the Marker template that you want.
Add, Edit and Save a Marker
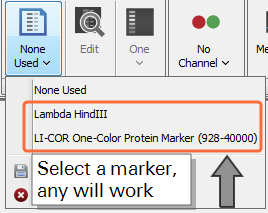
- In the Marker Lanes group, select any Molecular Weight Marker from the Select Marker Lanes Set list
 .
. -
Click Edit
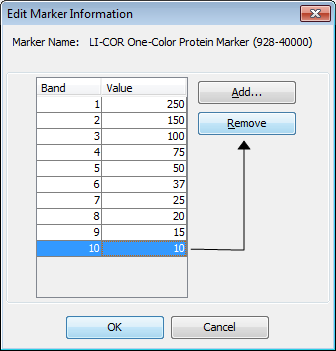
 . The Edit Marker Information dialog will open.
Changes made in this procedure will not overwrite the current marker, unless you save the changes with the current marker's name.
- In the Edit Marker Information dialog, click to select a weight and click Remove. Repeat this step until all appropriate weights have been removed (remove all weights if adding a new marker).
- Click Add to enter all the appropriate weight markers.
- After all appropriate weights have been added, click OK. The Select Marker Lanes Set list will display Custom.
- To save the newly added marker:
- In the Marker Lanes group, click the Select Marker Lanes Set list .
-
Click Save Current Marker Lane Set.
The Marker Set Name dialog will open.
- Enter the name of the marker and specify the channel (e.g. Chameleon Duo 700 or Chameleon Duo 800).
- Click OK.
The new marker has been added to the Work Area and saved.
Repeat this process for each channel if the Chameleon Duo or Chameleon Kit is being used.
The Chameleon Duo, Chameleon 700, Chameleon 800, and Chameleon Kit have a visible 260 kDa band. The band does not appear in the 700 nm channel for Chameleon 700, so DO NOT include this value when adding weights to the Chameleon 700 marker set.
If you are using the Chameleon 700 only (not Chameleon 800), there will be no 125 kDa band.
If you define more sizes than bands on a membrane, not all sizes in the marker are used. If you define fewer sizes than there are bands on a membrane, the bottom bands are not part of a standard.
Deleting a Marker
-
Select Delete Marker Lane Set... from the Select Marker Lanes Set list
.
The Delete Marker Lane Set dialog will open.
- Select the marker lane to delete and click Delete.
The deleted marker will still appear on other images where it was used previously. An asterisk will appear after the marker's name to designate that it is a deleted marker.
Background Group
The following options are available in the Background group.
-
 Define Type list - Choose a background subtraction method from the Define Type list.
- Average or Median - The Average or Median background method computes the average or median intensity of pixels in a border around a shape and subtracts that background from the shape.
- User-Defined - The User-Defined background method finds the average pixel intensity within a shape placed by the user to calculate background.
- Lane - The Image Studio Lane background method works by drawing a linear connection between areas of minimum brightness between shapes in a lane and subtracting the background noise that falls beneath the lines.
- None - Unless data are going to be exported for analysis using a third-party software, do not choose None.
-
 Assign Shape - When the User-Defined background method is chosen, this button is used to assign a shape to be used for background calculation.
 -
 Unassign Shape - Removes a User-Defined background shape from the background calculation.
Show Group
Use the controls in the Show group to specify what to display on the image. You can display Bands, Lanes, Labels, Quantification, Boundary, Marker Handle, and Local Background (see Show Group for further details).